requisis_ELM.ng
Monitoring Service for IBM® ELM
requisis_ELM.ng Monitoring Service for IBM® ELM is a Cloud-Service provided by REQUISIS.
After a deployment of a monitoring agent and enabling the Monitoring MBeans on your ELM-Machines and you can view your Monitoring Data on the Monitoring Dashboard and we can inform you whenever a measurement is outside the normal value range.
Monitoring includes
- Disk
- Database
- CPU & RAM
- User Experience Data
- ELM Application details
- Services
- Scenarios
- Asynchronous Tasks
- Active Uses
- Consumed Licenes
- Jena Index
- LQE & TRS
- Datashape
- Number of Artifacts, Streams, Changesets, Baselines etc.Data Shape
IBM is a trademark of International Business Machines Corporation registered in many jurisdictions throughout the world.
REQUISIS uses that trademark as IBM Business Partner in order to provide Services for IBM Products.
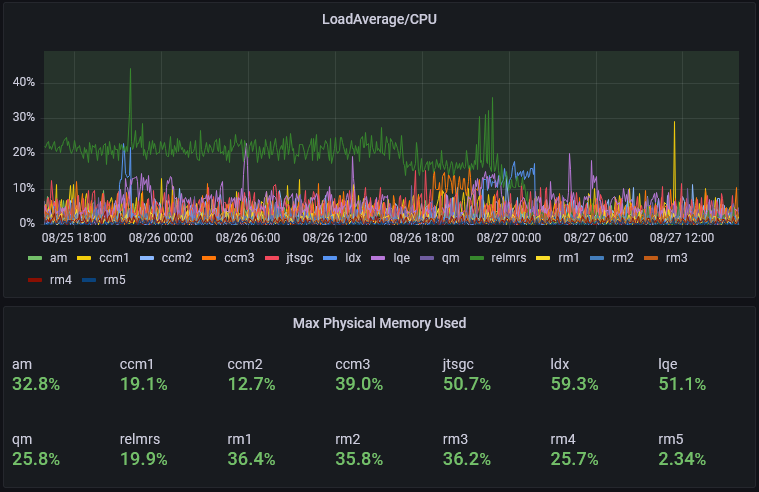
CPU & Memory
With CPU & Memory Monitoring you can identify e.g.:
- Are enough resources allocated for the application?
- Are there certain times where high load is observed?
- Is the high load related to the number of active users or to a background service?
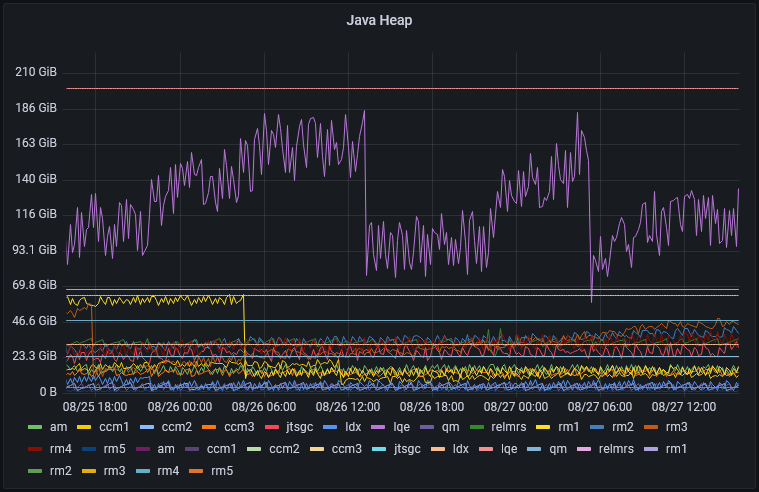
Java Heap, Stack and Threads
With the Monitorig of Java Heap, Non-Heap and Threads you can identify e.g.:
- Is there enough Heap free?
- When does the Heap usage grow?
- Identify times with high number of threads.
- Are the numbers of threads realted to the numeber of active uses?
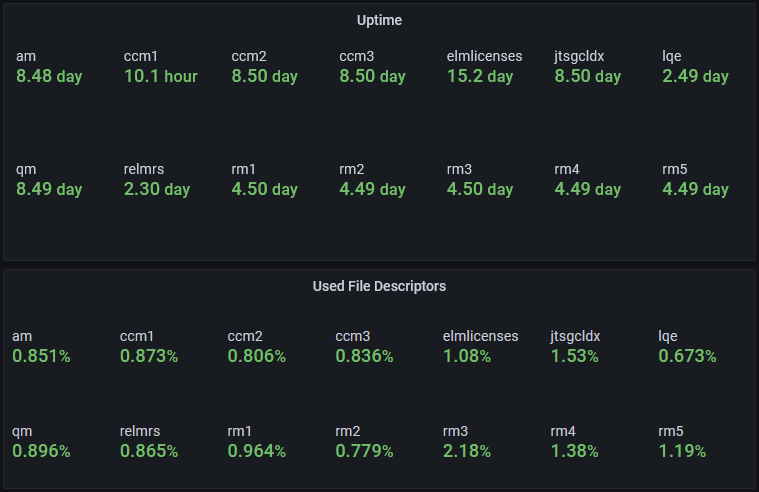
Uptime and File Descriptors
Uptime Monitoring allows you to put other values in relation to the uptime and reboot times.
File-Descriptor Monitoring will help you to detect a very basic configuration issue.
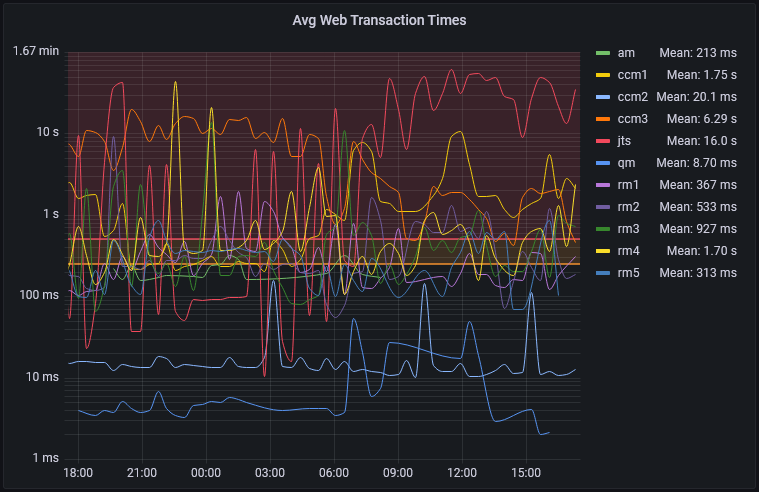
Requests and Response Time
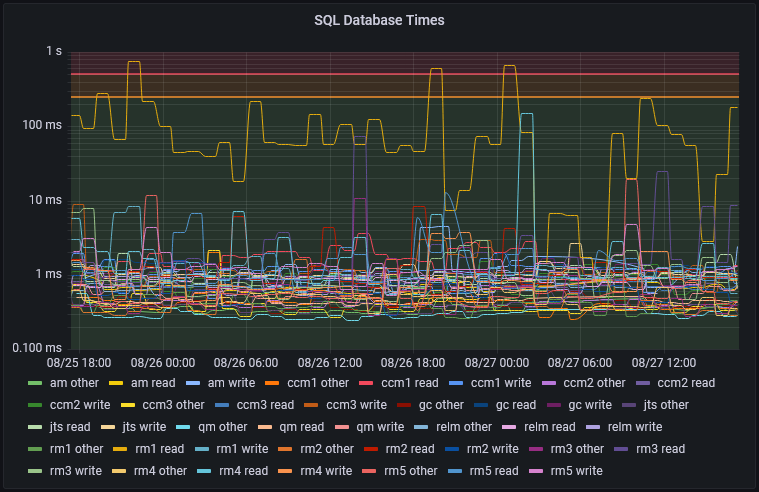
Database Montoring will monitor the database from the application perspective to identify:
- How many requests are sent to the database?
- How is the database response time?
- Is the database response time growing when more requests are sent?
- Is the database under heavy load?
- The relation with other measurements allows you to identify the reasons, like number of active users, running background tasks, services or scenarios.
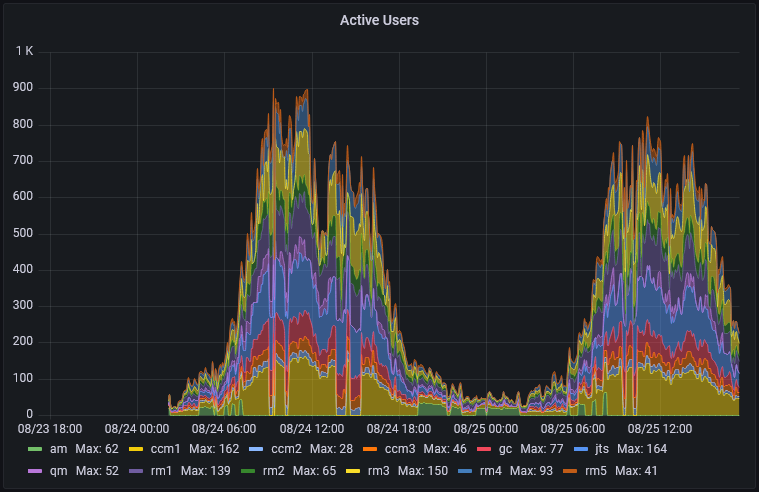
Active Users
Monitoring the number of active users allows you to put other measurements into a relation with the number of active users like:
- Does the number of active users have an impact on user experience, performance, RAM or CPU Usage?
- Up to what user count is my current hardware sufficient?
- Is the load related to the users or to other actions?
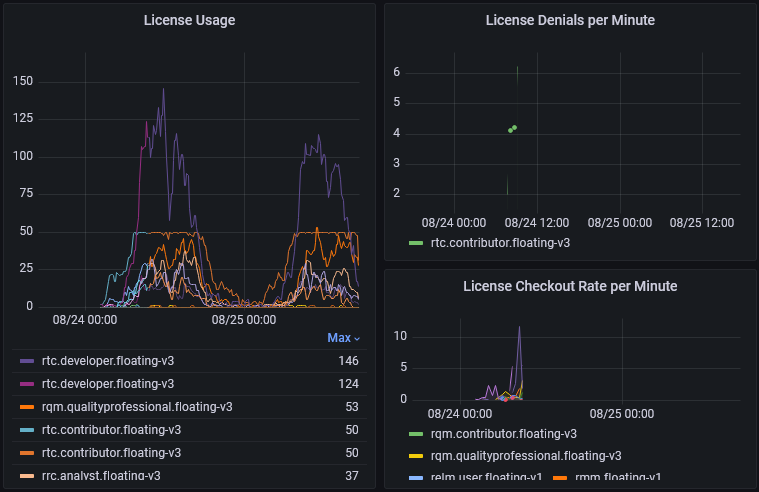
Consumed & Denied Licenes
Monitoring the licenses will allow you to:
- Do we have enough licenses, or are some users denied?
- Do we have the right types of licenses (e.g. contributor vs. professional/analyst licenses)?
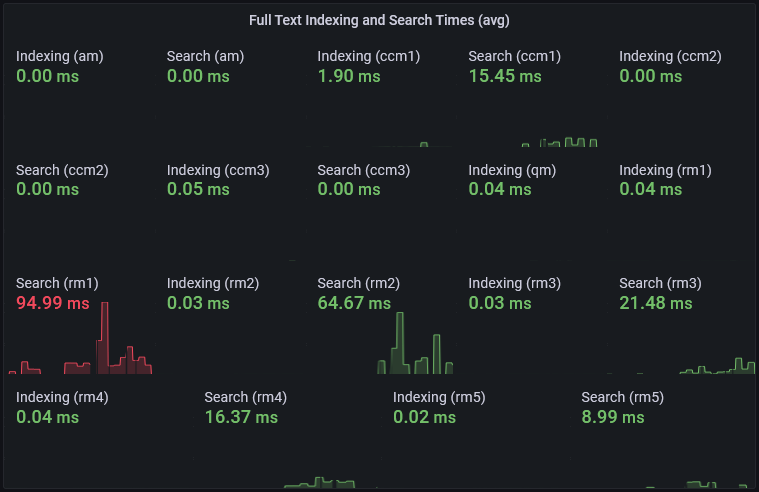
Indexing & Search Times
Monitoring the services allows to detect:
- Which services are running long time?
- Which services consume much time?
- What are the most active or time consuming services?
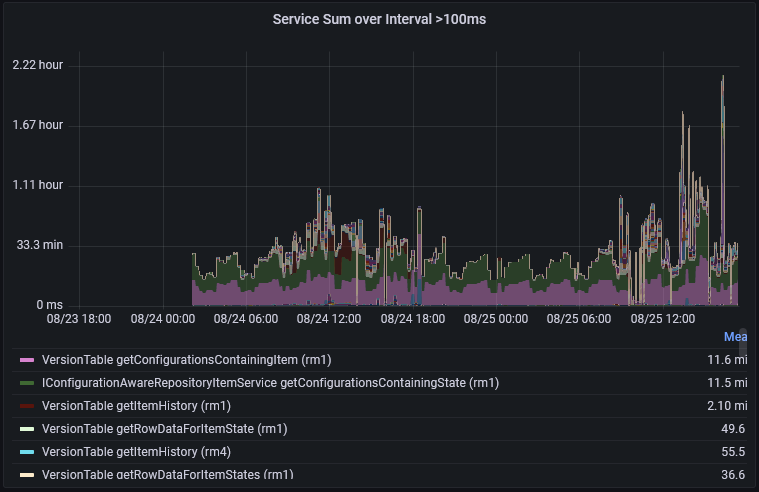
Services
The monitoring of the Servies allows you to monitor the performance and execution time of Internal Services.
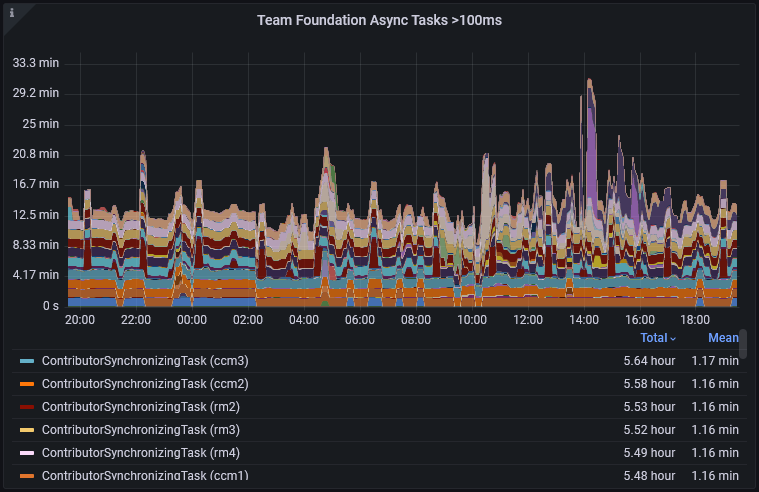
Asynchronous Tasks
Monitoring the asynchronous tasks gives you information about:
- Times tasks that are running in Background where the user needs to wait.
- Identify the times a change-set needs to commit
- Identify a compare needs
- …and much more
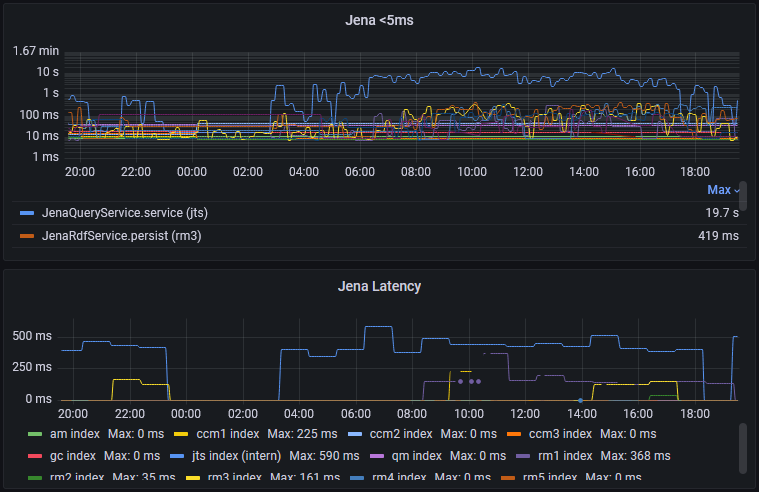
Jena Index
The Jena Index is still used in some applications. Some operations need a fast Jena Index.
With Monitoring you can identify:
- Is the Jena Index running properly?
- How is the performance of the Jena Index?
- If the performance is low use other measures to identify the reason.
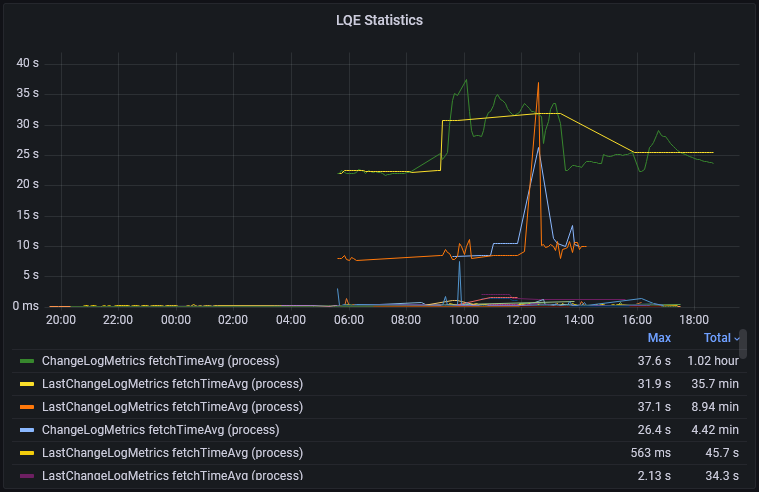
LQE & TRS
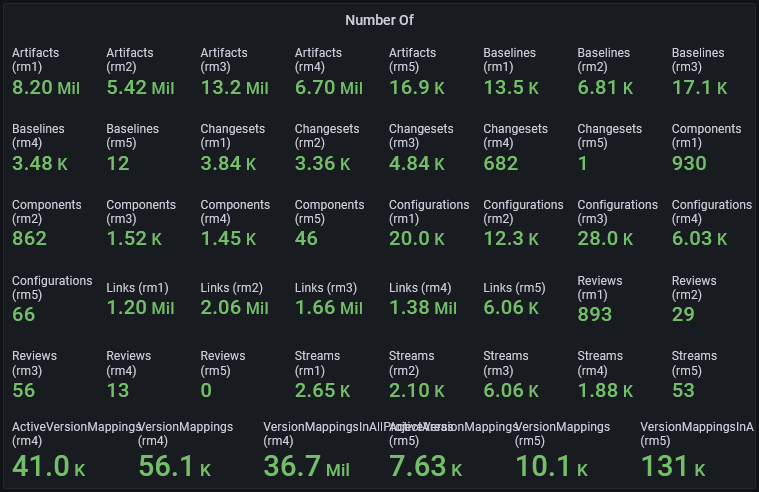
Data Shape
Data Shape analysis allows you to get information about the data you have to foresee problems in the future like:
- Number of Components
- Number of Streams
- Number of Changeset
- Number of Baselines
- Number of Artifacts, Testcases etc.
- Number of Artifacts per Project Area
- Stream-Depth